

Crypto Price Analysis 7-22 BTC, ETH, SOL, DOT, DOGE, UNI, ADA, WIF
Table of Contents
Bitcoin (BTC) registered an impressive increase over the weekend, with the price overcoming a crucial resistance level to move above $65,000. The move above $65,000 came after a slight pullback. However, spot Bitcoin ETFs continued to receive inflows, indicating that while markets were cautious, they had not turned bearish.
BTC’s recovery could set it on the path to $70,000 and a new all-time high, with the price on an upward trajectory since it closed above the 200-day SMA on July 14.
Smart Money Continues BTC Buying Spree
Bitcoin (BTC) registered a strong weekend, climbing over the crucial $65,000 mark, as bulls seized the initiative after a slight pullback. The cryptocurrency has registered an 8% increase over the past week, with the $70,000 level in its sights. BTC’s recovery can be attributed to significant inflows into spot Bitcoin ETFs and whale accumulation. If BTC’s current surge continues, we could see a push toward a new all-time high.
According to data from Lookonchain, an on-chain data tracer, BTC whales have been on a buying spree and have accumulated a considerable amount of the cryptocurrency. It highlighted a single BTC whale who purchased 213.78 BTC in the past 24 hours. The whale in question has bought a total of 677 BTC over the past four days, with the total value of the whale’s holdings a staggering $45.6 million.
“This smart money bought 215.5 $BTC($14M) again 16 minutes ago and currently holds 463.16 $BTC($30M).”
According to analysts, such large-scale purchases highlight the confidence of major investors in BTC’s potential. Nate Geraci, president of the ETF Store, also highlighted the crucial role of spot Bitcoin ETFs in the US. According to Geraci, US-listed spot Bitcoin ETFs hold 900,000 BTC, which is approximately 4.3% of the total BTC supply, with their current valuation a staggering $60 billion.
Bitcoin (BTC) Price Analysis
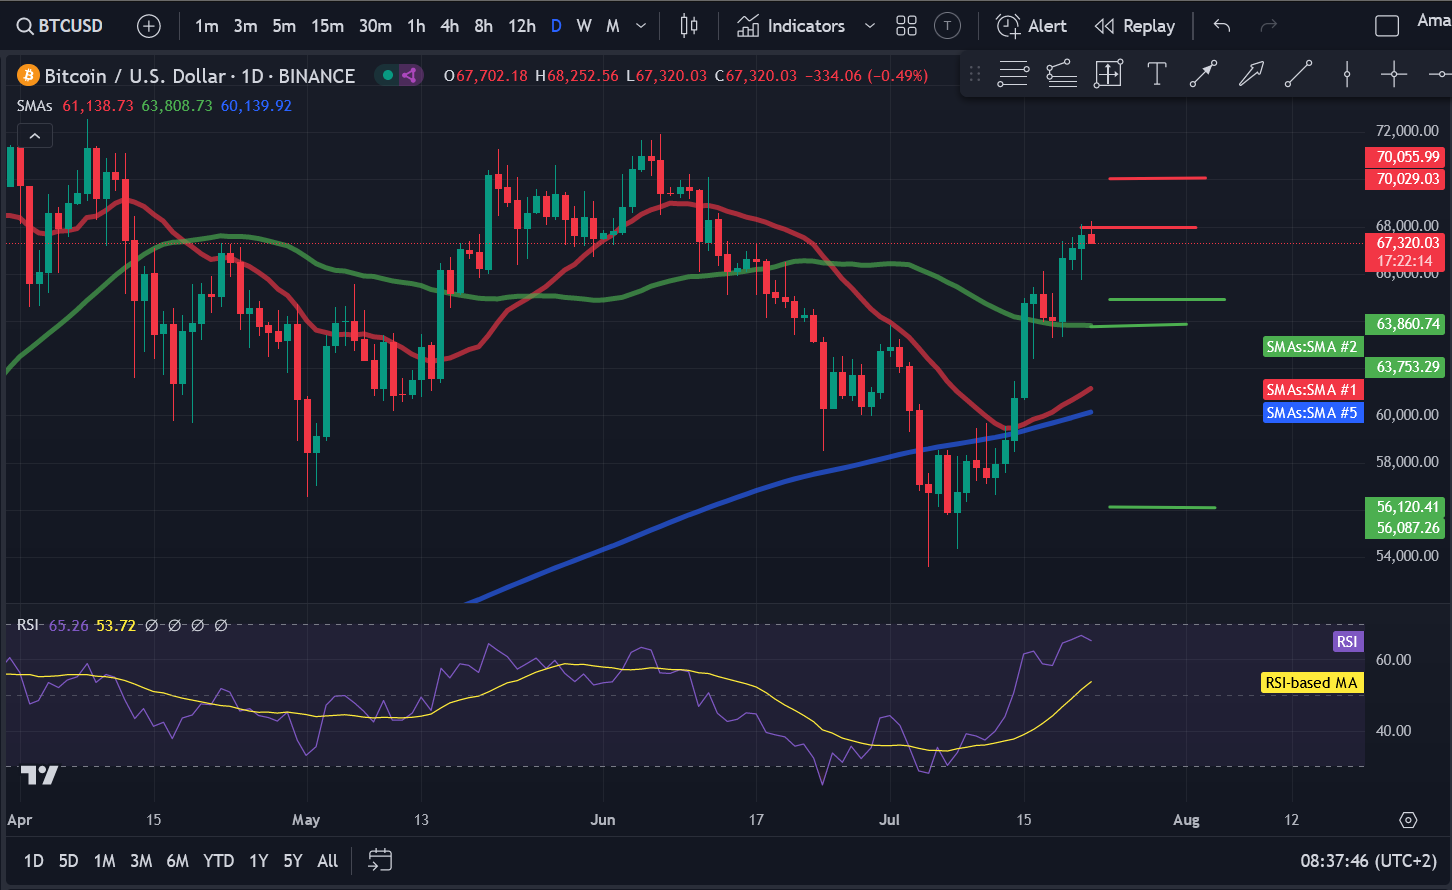
Looking at the Bitcoin (BTC) price chart, we can see a V-shaped recovery. BTC registered a strong upward trajectory after hitting a low of $53,591 on July 5, representing an increase of just over 26%. BTC had attempted to push above $65,000 on Wednesday but faced considerable selling pressure. As a result, BTC fell by 1.49% to $64,156 after reaching a day high of $66,135. Thursday saw a notable spike in volatility as buyers and sellers attempted to establish control. BTC eventually registered a marginal decline and settled at $64,027.
Source: TradingView
With strong support at $64,000, BTC rallied on Friday as buyers entered the market, propelling it past the resistance at $65,000 after a 4.10% increase which saw it settle at $66,652. BTC continued to be bullish over the weekend, rising by 0.65% on Saturday and 0.84% on Sunday to move to $67,654. However, Sunday also saw BTC overcome significant selling pressure as sellers attempted to push BTC back below $65,000. As a result, BTC fell to a day low of $65,730, managing to stay above $65,000. The current session sees BTC down marginally, with sellers having pushed the price down from $68,000. We could see selling pressure increase during the ongoing session, with sellers attempting to push the price below $65,000 once again. However, if BTC is able to stay above $65,000, we could see a retest of the $68,000 resistance zone and a push towards $70,000.
However, the RSI is close to the overbought zone, indicating a short-term correction.
Ethereum (ETH) Price Analysis
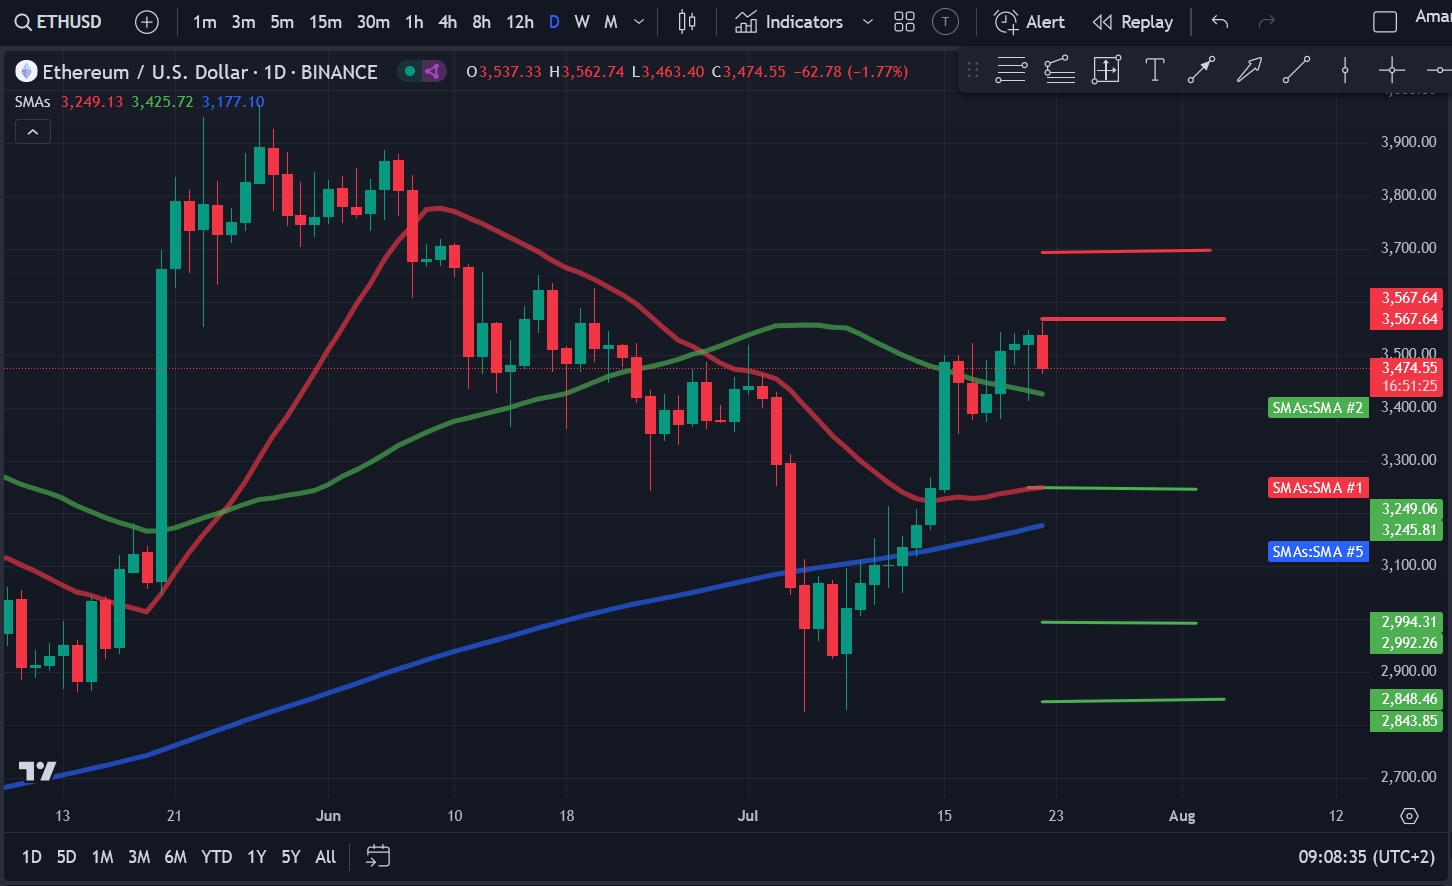
Ethereum (ETH) registered a strong recovery over the weekend, which saw the price climb above $3,500 ahead of the launch of the sp[ot Ethereum ETFs. While bulls tried to extend the recovery, ETH faced significant selling pressure, as can be seen in the price chart. While ETH may be in the red in the current session, it has registered an impressive increase over the past week. It surged by 7.37% at the beginning of last week, rising to $3,486. However, with sellers active at this level, ETH was down to $3,389 by Wednesday.
ETH made a strong push towards $3,500 on Thursday, reaching a day high of $3,490, but sellers were able to push the price down to $3,426, an increase of 1.09%. Friday saw strong demand as ETH moved past the 50-day SMA and $3,500 to settle at $3,501. The price remained in the green over the weekend, although it faced significant selling pressure, as seen in the price chart. Sellers pushed ETH to a day low of $3,413 on Sunday, but the price recovered and pushed back above the 50-day SMA, eventually settling at $3,537.
Source: TradingView
The current session sees ETH down by 1.75% as sellers look to push ETH below $3,500 once again. Some analysts have predicted that should the initial hype around spot ETH ETFs wear off, it could lead to a drop in the price of ETH. So far, ETH has managed to remain above the 50-day SMA. Should buyers continue to remain above it and reclaim $3,500, it could propel ETH to $3,700. Bears are expected to defend this level, but a push to $4,000 cannot be ruled out if bulls win out. However, if sellers are able to push ETH below the 50-day SMA, we could see ETH drop to $3,300, where the 20-day SMA could act as support. With Cboe confirming that spot Ethereum ETFs will begin trading on July 23, we can anticipate a spike in the price of ETH.
Solana (SOL) Price Analysis
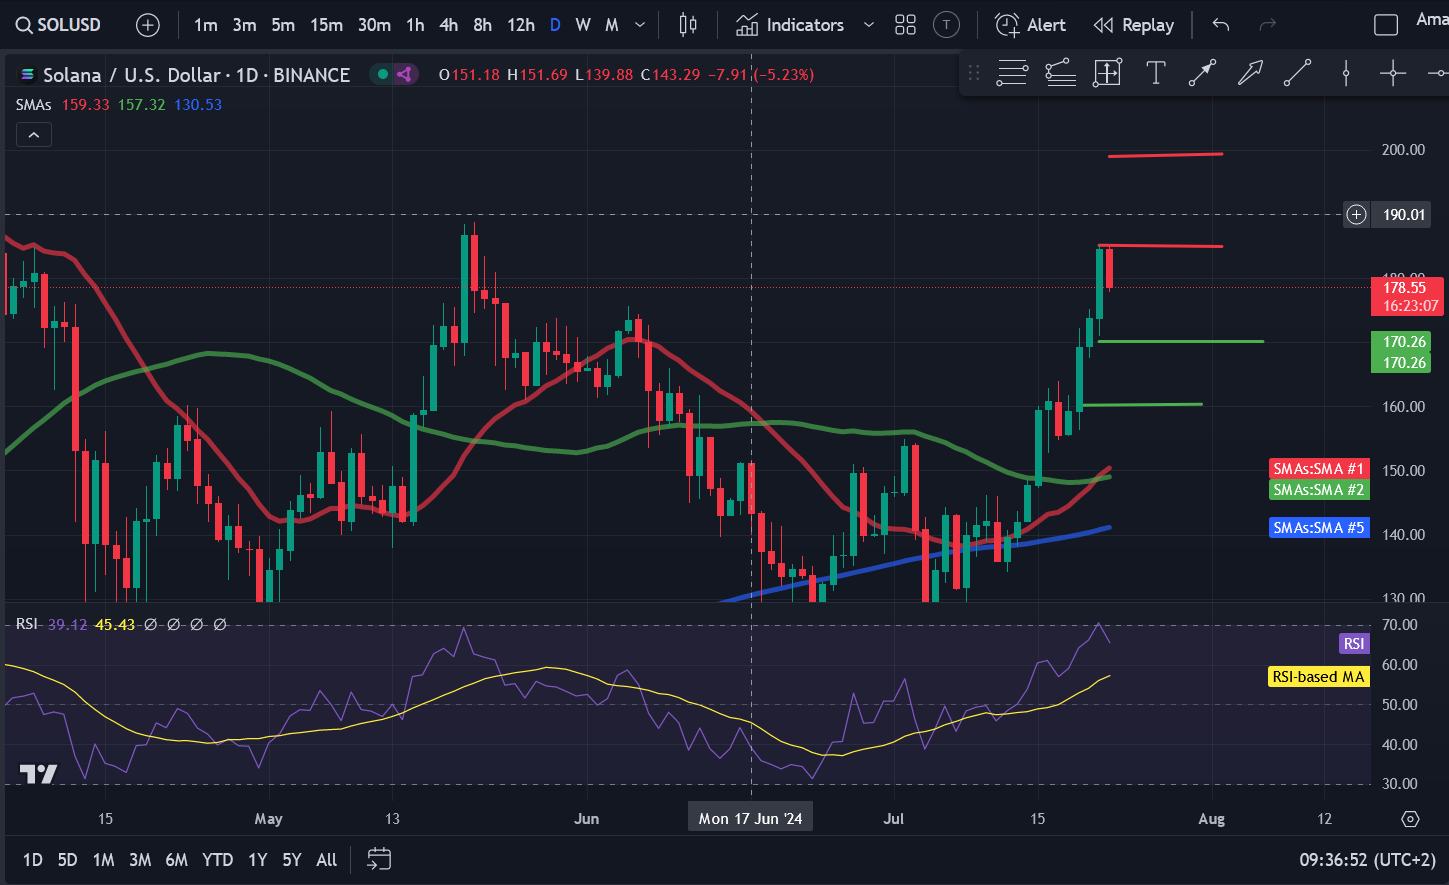
Solana (SOL) has registered a remarkable recovery over the past couple of weeks. The last seven days have seen the cryptocurrency surge by almost 17% as buyers eye the $200 level. The price has seen a remarkable recovery since dropping by 3.23% on Wednesday, with bears unable to push the price below $150. SOL made a strong push towards $160 on Thursday, rising by 2.35%. However, despite the bullish sentiment, it was unable to do so and settled at $159.25. A 6.30% increase on Friday allowed SOL to push above $160 and settle at $169.29, putting the bulls firmly in control.
Source: TradingView
As a result, the weekend saw a significant push towards $180. SOL registered a 2.62% increase on Saturday, allowing it to break above the resistance at $170 and settle at $173.73. Sellers attempted to push SOL back below $170, but the price rebounded after hitting a day low of $170.93, surged by 6.20%, and pushed above $180 to settle at $184. With sellers active at this level, SOL has registered a drop during the ongoing session and is down by 3.35%, trading below the $180 mark. With the 20-day SMA on the up, it is an indication that the bulls have the edge. However, the RSI suggests we could see a drop in the short term.
If SOL is able to withstand bearish pressure and stay above $170, we could see a rebound and a push towards $200. However, if the bears are able to push SOL below $170, we could see a drop down to the $160 support level.
Polkadot (DOT) Price Analysis
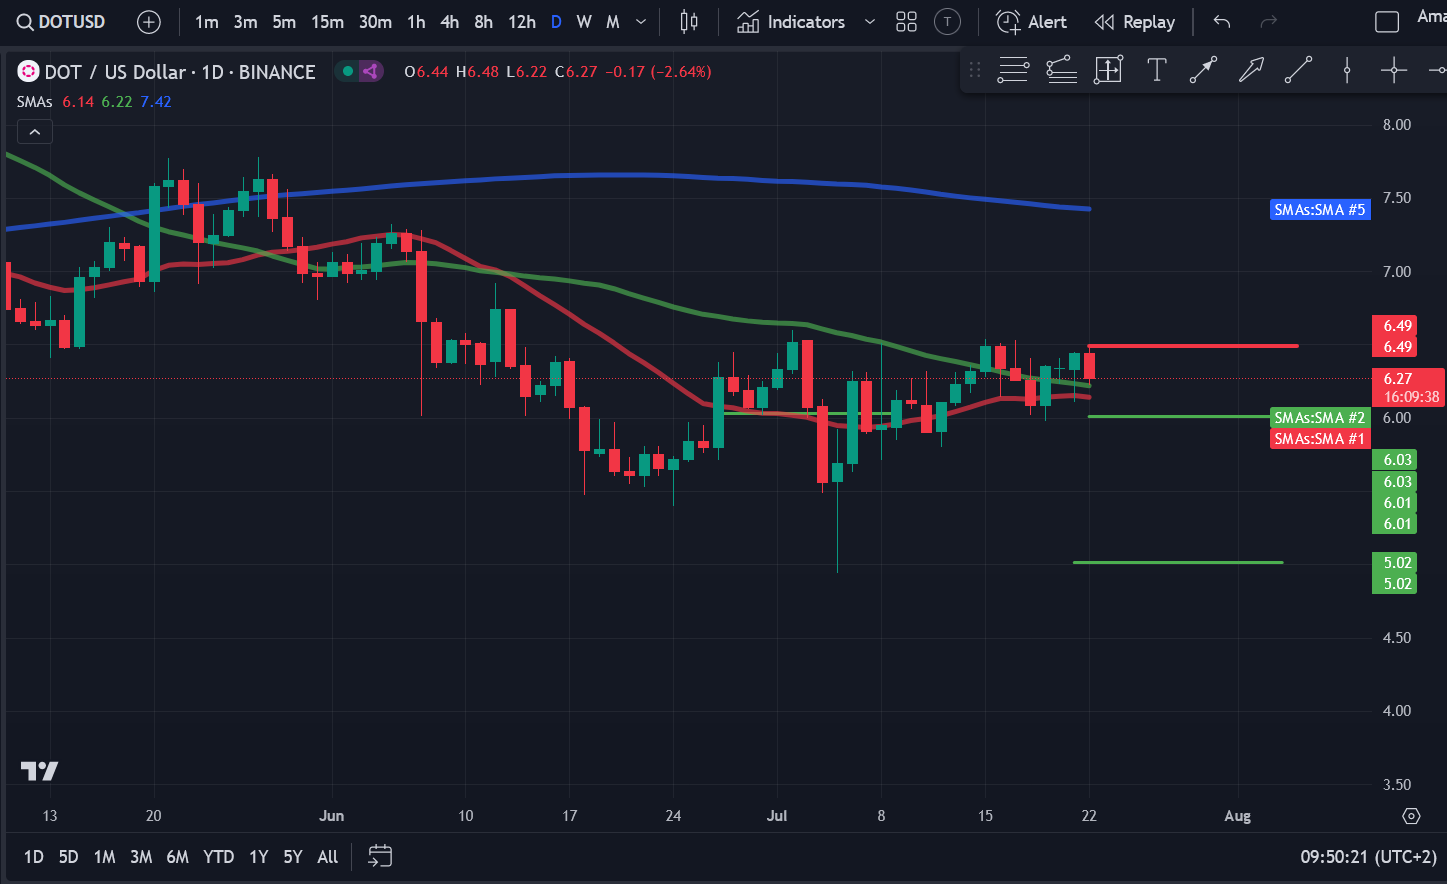
Polkadot (DOT) has yet to capitalize on the crypto market bull run, with its price movement being rather underwhelming compared to other major altcoins. The cryptocurrency has struggled to push above the $6.50 level, having failed to go above this resistance level a number of times. The previous week saw considerable volatility, and while DOT recovered, it found itself in the red once again during the current session. DOT had been extremely positive over the previous weekend and rose to $6.49 the previous Monday. However, it could not move any higher thanks to significant bearish pressure and was down to $6.90 by Thursday. Thankfully for DOT, it has strong support at $6, and as a result, it made a strong recovery on Friday, pushing above the 20 and 50-day SMAs and settling at $6.35.
Source: TradingView
The weekend saw DOT make yet another attempt to push above $6.50, rising to $6.44 despite facing considerable selling pressure. However, buyers were unable to sustain the momentum, with DOT falling back in the red during the ongoing session. Currently, DOT is down by almost 3% and trading at $6.26. If the current bearish sentiment continues, DOT could drop back to its support level of $6, after which we could…
Read More:Crypto Price Analysis 7-22 BTC, ETH, SOL, DOT, DOGE, UNI, ADA, WIF