

Crypto Price Analysis 7-15 BTC, ETH, SOL, TON, XRP, MATIC, DOT
Table of Contents
Bitcoin (BTC) bounced off its support levels last week, which held firm, indicating strong demand at lower levels. It made a strong recovery over the weekend, breaking past $60,000 with a strong rally.
With demand skyrocketing at lower levels, it’s clear that institutional investors viewed the recent dip as a buying opportunity. According to data from the on-chain analytics platform CryptoQuant, institutional investors acquired 100,000 BTC during the week.
Positive Signs For The Crypto Markets
The cryptocurrency market had plenty to cheer about over the weekend. First, it was reported the German government’s BTC selling spree is over, with the authorities having sold over 88% of its original BTC holdings, with the amount held in the government’s BTC wallet down to 5,800. In its latest transfer, the German government sent BTC to several exchanges, including Bitstamp, Coinbase, and Kraken. Crypto analyst Michael van de Poppe pointed out that it was incredible that the markets had absorbed all this selling pressure, and BTC had still managed to climb above $60,000.
“It’s incredible that this sell pressure has been absorbed and that Bitcoin’s price is around $60K.”
The markets will now closely watch the developments related to Mt. Gox and its creditors once they receive their repayments from the exchange. BTC could see a considerable recovery if selling remains subdued. However, if the creditors decide to dump their holdings, we may see selling pressure return to the markets.
Bitcoin (BTC) Price Analysis
Bitcoin (BTC) broke past the $60,000 barrier over the weekend and has climbed above $62,000 during the current session, with analysts saying the worst could be over. BTC had shown considerable volatility towards the end of the previous week. Buyers attempted to push the price above $60,000 on Thursday but encountered significant selling pressure. Eventually, BTC settled at $57,386, a drop of 0.76%. Friday saw BTC flip the bearish sentiment as it rose by 0.99% to push to $57,952, and an increase of 1.71% on Saturday took BTC to $58,944 as it closed just below the 200 and 20-day SMAs.
BTC bulls successfully pushed to $60,000 on Sunday, as the cryptocurrency registered a 3.06% increase to push above the 20 and 200-day SMAs and climb above $60,000 to settle at $60,750. The current session sees bulls firmly in control, with BTC trading at $62,772, an increase of 3.27% over Sunday. With bullish sentiment back in the market, where does BTC go from here?
Source: TradingView
Analysts have stated that a Bitcoin pump wouldn’t happen overnight. With BTC breaking above $60,000, it would have to close and stay above this level for some time to flip the $60,000 resistance into support. It would also need to claim the 20 and 200-day SMAs before it can begin a rally. For now, bulls will look to push BTC towards the 50-day SMA at $64,000. Any further price movements would require BTC to consolidate above $60,000.
Ethereum (ETH) Price Analysis
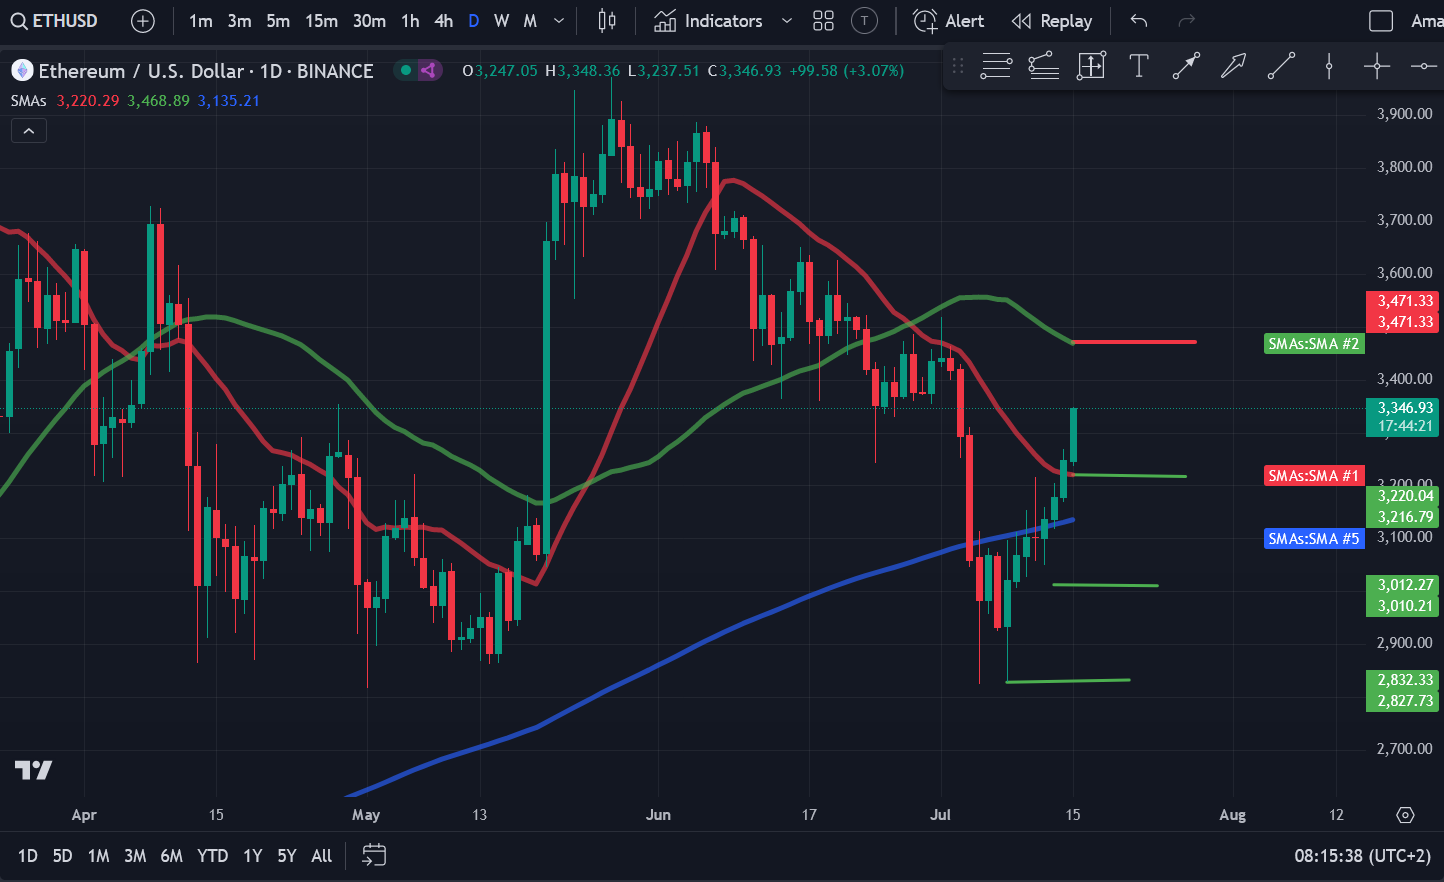
Ethereum (ETH) has started a relief rally, which has seen the cryptocurrency register an increase of almost 15% over the past week. The recovery comes after significant excitement around the potential approval of spot Ethereum ETFs sometime during the coming week. ETH has been extremely bullish since rebounding from its support levels last week and closing above $3,000. With buyers looking to push it above the 20-day SMA, ETH registered significant volatility on Thursday, as it rose to a day high of $3,215. However, with considerable selling pressure at higher levels, sellers were able to push the price back down, with ETH eventually settling at $3,101.
Source: TradingView
Friday saw ETH push above the 200-day SMA and settle at $3,136. However, ETH was still encountering selling pressure at higher levels. The weekend saw ETH continue to push upwards, rising to $3,178 on Saturday and then moving above the 20-day SMA on Sunday thanks to an increase of 2.17%, which took the price to $3,247. The current session sees ETH up by almost 3% as buyers look to push toward the $3,500 level and the 50-day SMA.
With ETH gaining strength, a close above $3,400 could send the price above $3,500. However, if there is a reversal, we could see the price drop to $3,200. A continuation of bearish sentiment could see a dip to $3,000. For now, the bulls command the market.
Solana (SOL) Price Analysis
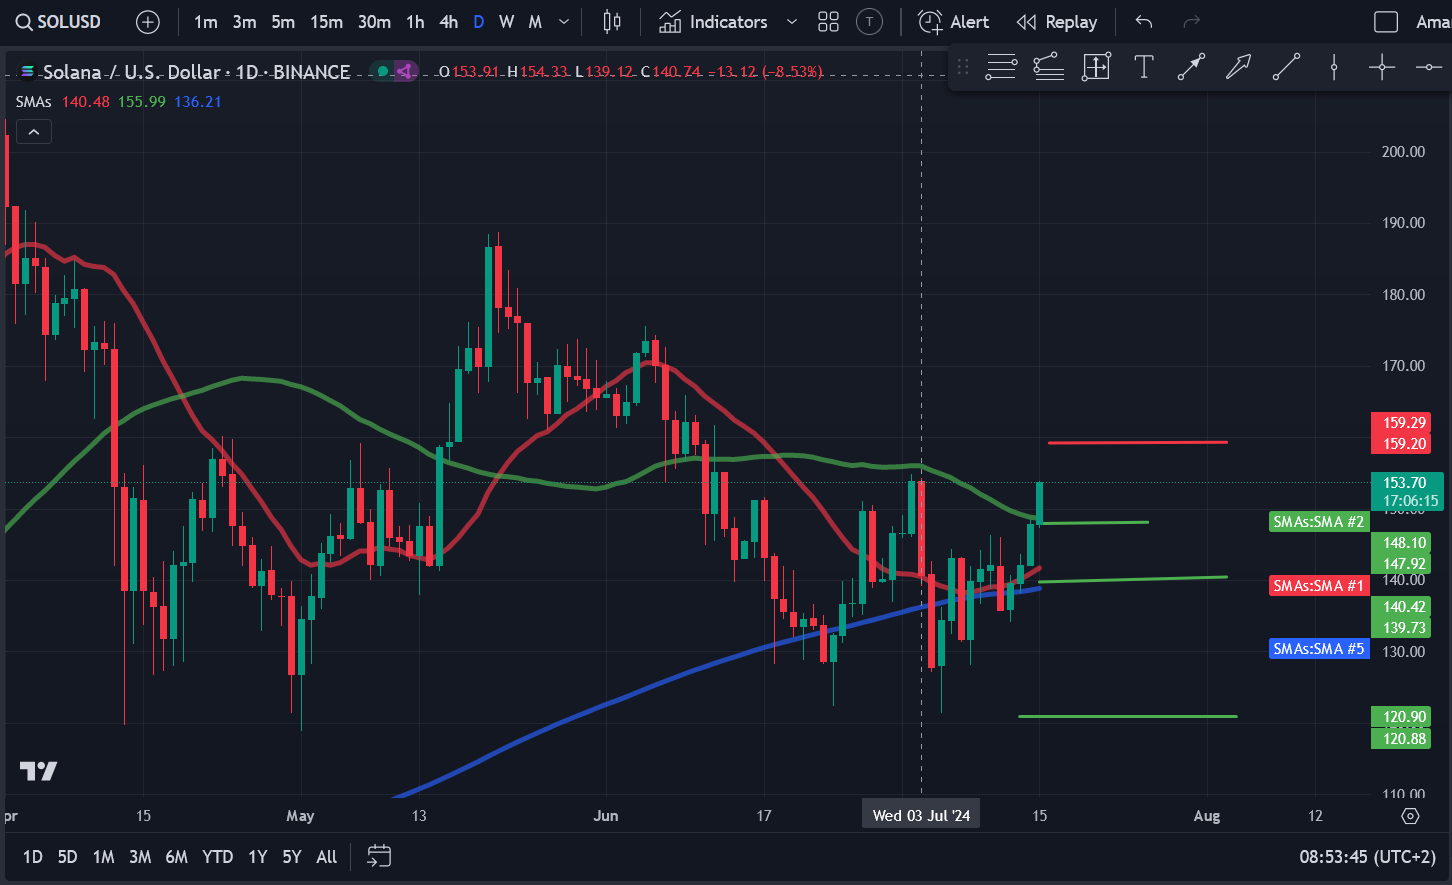
Solana (SOL) surged over the weekend and pushed above $150 during the ongoing session, with indicators and network metrics suggesting a strong rally. SOL has seen considerable volatility in the past week but has been on a firm upward trajectory since Friday when it rose by 2.78% to push above the 200-day SMA to $139.60. Saturday saw SOL push above $140 and the 20-day SMA to $142.04. Bullish sentiment persisted on Sunday, with SOL registering an increase of just over 4% to move to $147. Buyers attempted to push above the 50-day SMA but could not do so.
Source: TradingView
SOL broke past $150 and the 50-day SMA during the ongoing session, with the price currently at $152.65, an increase of 3.31%. Solana’s network metrics have been nothing short of impressive, with the network’s current TVL at $4.67 billion. With developments regarding the Solana ETFs also in the pipeline, interest in SOL is bound to increase, and we could see this reflected in the price of the token. With SOL currently trading at $153, a move to $160 is not out of the question if bulls can maintain momentum. Should the price push above this level, we could see a move towards $200. However, SOL must consolidate above the $150 level for any sustained upward momentum. Crucial support levels for SOL sit at $140 and $120.
Toncoin (TON) Price Analysis
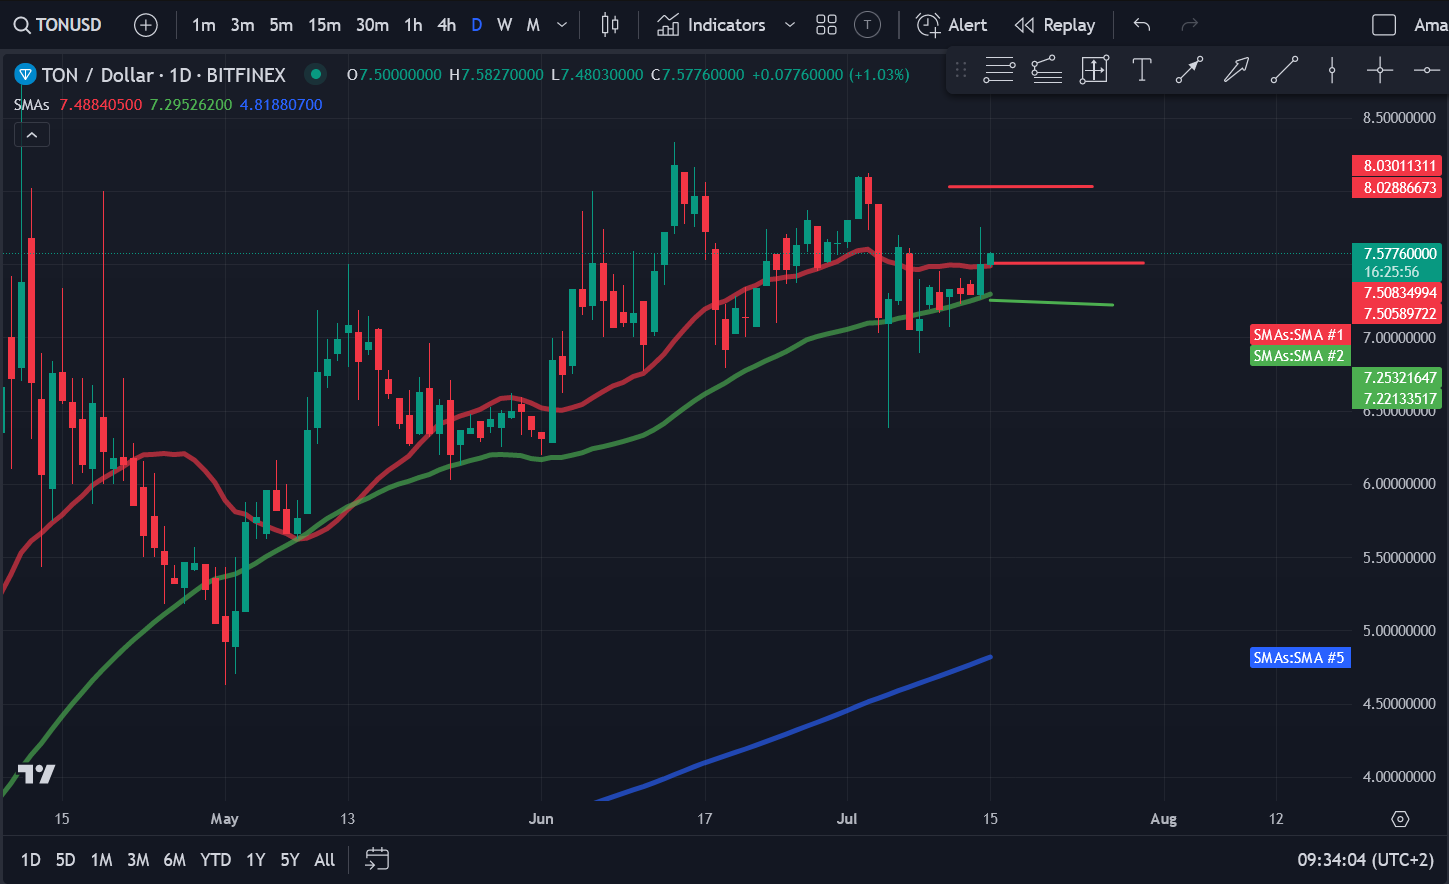
Toncoin (TON) has been trading between the 50-day SMA, which has been acting as a dynamic level of support, and the 20-day SMA, which has been acting as resistance. After spending most of the previous week shuttling between $7.20 and $7.50, TON made a decisive surge on Sunday as buyers attempted to push the price above the resistance at $7.50. TON reached a day high of $7.75, but with bears defending the resistance levels, TON fell back, eventually settling at $7.50. The current session sees TON up by just over 1% as buyers look to push the price above $8.
Source: TradingView
If buyers are able to recover momentum, we could see a move towards $8. However, if bullish momentum wanes, TON could fall back towards the 50-day SMA. If bears manage to breach this level of support, a slide to $7 can be expected.
Ripple (XRP) Price Analysis
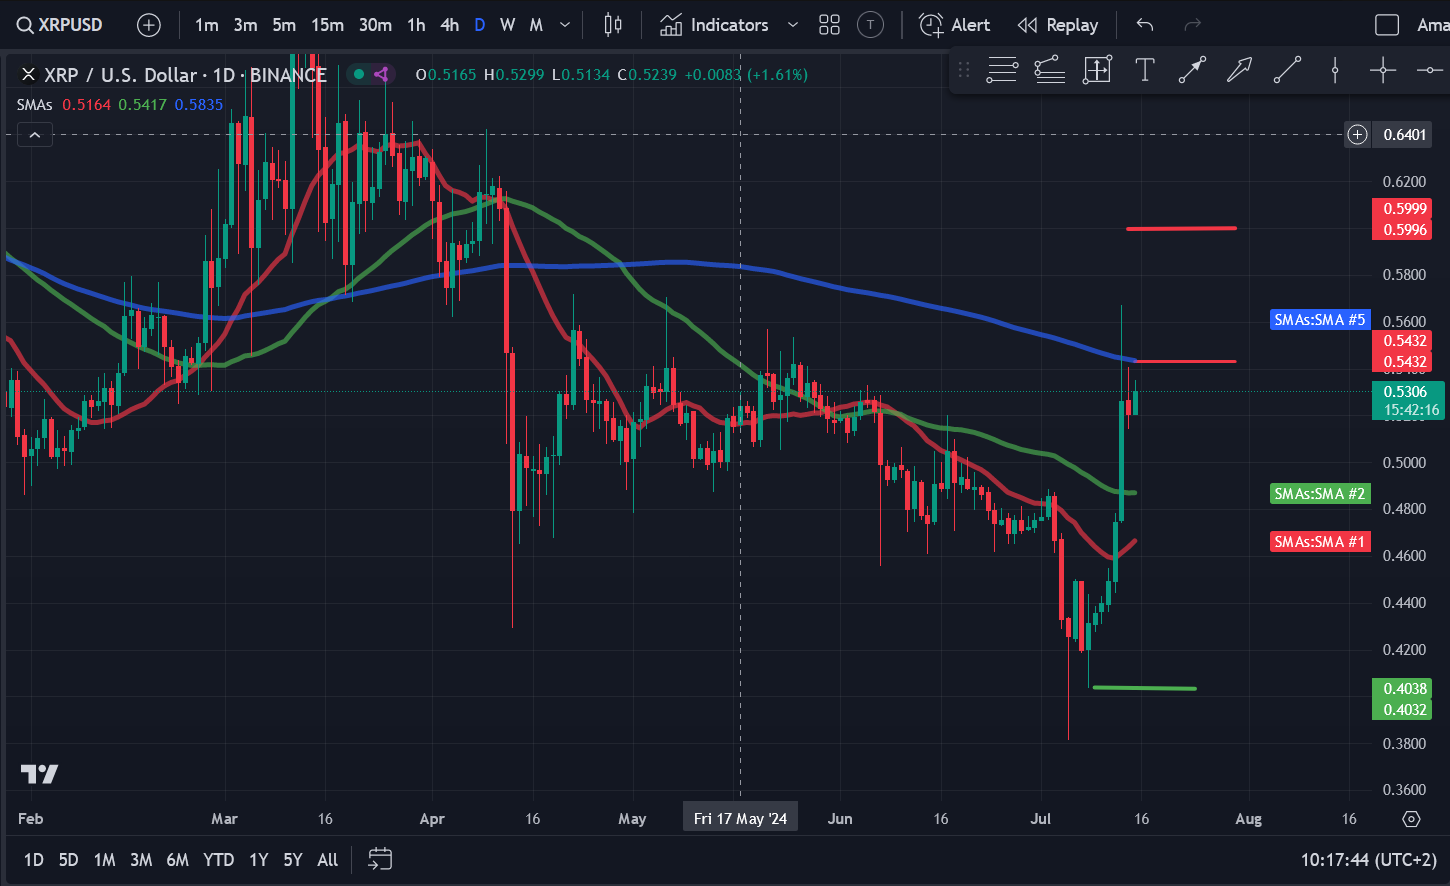
Ripple (XRP) surged over the weekend as bulls continued to push the price higher, hitting $0.50 on Saturday. XRP has been extremely bullish over the past week, with the asset surging over 25% during the past week in a run that has seen it outperform nearly all other major cryptocurrencies. XRP’s recent upward push saw the asset smash crucial resistance levels at $0.44, $0.46, $0.48, and $0.50.
The cryptocurrency registered a significant increase on Friday, rising by 5.63% to move above the 20-day SMA and settle at $0.47. Saturday saw XRP surge by nearly 11% as buyers pushed towards $0.50. So strong was the bullish sentiment that XRP registered a day high of $0.56 before settling at $0.52 due to sellers being active around the 200-day SMA. Sellers were able to push XRP lower on Sunday, with the asset facing considerable volatility and then dropping by just over 1%. The current session sees XRP up by just over 2% as buyers look to retest the resistance at $0.54.
Source: TradingView
As mentioned earlier, XRP faces significant resistance at the 200-day SMA, a substantial barrier to surpass. XRP tested this resistance on Saturday but fell back after facing significant selling pressure. However, with XRP consolidating above $0.50, it could test this level once again. If XRP is able to break above this level, we could see a push towards the next significant resistance level at $0.60.
Polygon (MATIC)…
Read More:Crypto Price Analysis 7-15 BTC, ETH, SOL, TON, XRP, MATIC, DOT