

Crypto Price Analysis 7/02 – BTC, ETH, BNB, SOL, AVAX, SHIB, MATIC, TON
Table of Contents
Bitcoin (BTC) and the broader crypto market have posted a strong rally over the past few days, with BTC registering an intra-day high of $63,845 on Monday, July 1.
However, traders are worried that some factors, such as the impending Mt.Gox repayments, could adversely impact this upward trajectory.
Bears Wage A Losing Battle
Bitcoin has been quite bullish since the weekend after sellers failed to push BTC below $60,000 or drag it to the lower range of its $56,500 to $73,000 range. When an asset trades in range, it generally trades between the support and resistance levels, with volatility in the middle ranges. The current support level at $60,000 has been tested twice in the past week, with the price rebounding strongly each time. A lower level of support exists at $58,400. July has been historically known as a positive month for Bitcoin. If history repeats itself, BTC’s recovery could pick up even more speed. Historical data has shown that there has always been a sharp uptick in July after a negative end to June.
However, some investors are being cautious, flagging risks that could lead to more than a wobble in this recent rally. The Mt. Gox repayments, set to begin during the current month, could lead to the creditors exiting the market to lock in their massive gains in BTC since the hack occurred. This could lead to significant selling pressure, which could drag BTC lower.
Bitcoin (BTC) Price Analysis
As we can see from the Bitcoin (BTC) price chart, BTC has been on an upward trajectory since the weekend, as buyers push the price above $64,000. BTC dropped to $60,412 on Friday, a decline of 2.07%. However, sellers were unable to push the price below its support level of $60,000. Saturday saw BTC make a recovery with buyers entering the market, pushing the price to $60,987, an increase of 0.95%. Sunday saw bullish sentiment intensify as BTC registered an increase of almost 3%, rising to $62,741.
BTC started the current week in the green, with buyers attempting to push the price above $64,000. BTC reached an intraday high of $63,845. However, it was unable to move past the 20-day SMA, which acted as a strong level of resistance, eventually settling at $62,984. The current session sees BTC marginally up as buyers and sellers struggle to control the session. Bulls are looking to strengthen their position further by pushing above $64,000. Should they succeed, BTC could move to $65,000 and then to the 50-day SMA at $66,400. If the price can close above this level, it could attempt a move to $72,000.
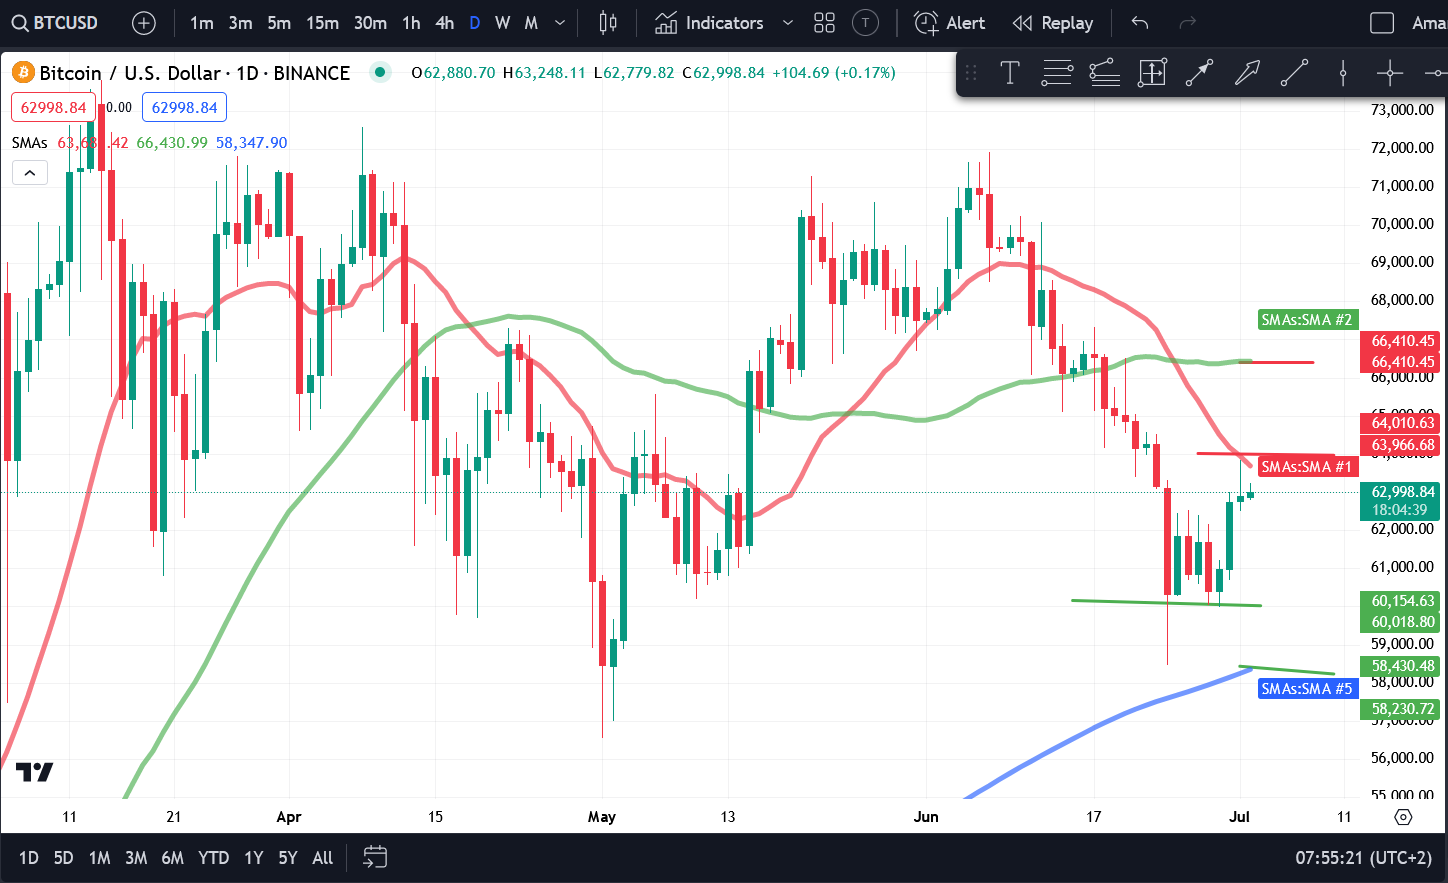
Source: TradingView
However, sellers are expected to defend this level vigorously, and should buyers fail to maintain their momentum, we could see a drop to $64,400. Sellers will try and flip this level into resistance should BTC drop lower, with the price expected to stabilize around the $60,000 mark.
Ethereum (ETH) Price Analysis
Ethereum (ETH) has also been in the ascendency as buyers attempt to start a rally to take the price above the 20-day SMA, which has held firm as a level of resistance thus far. ETH registered a drop of just over 2%, dropping to $3,376, close to its support level of $3,350. Saturday saw a marginal drop as bears attempted to breach the support level. However, ETH was able to rebound on Sunday, rising by 1.82% to $3,436. The current week began with buyers attempting to push ETH above the crucial resistance levels at $3,460 and $3,500. However, sellers were able to defend these levels, with ETH registering only a marginal increase.
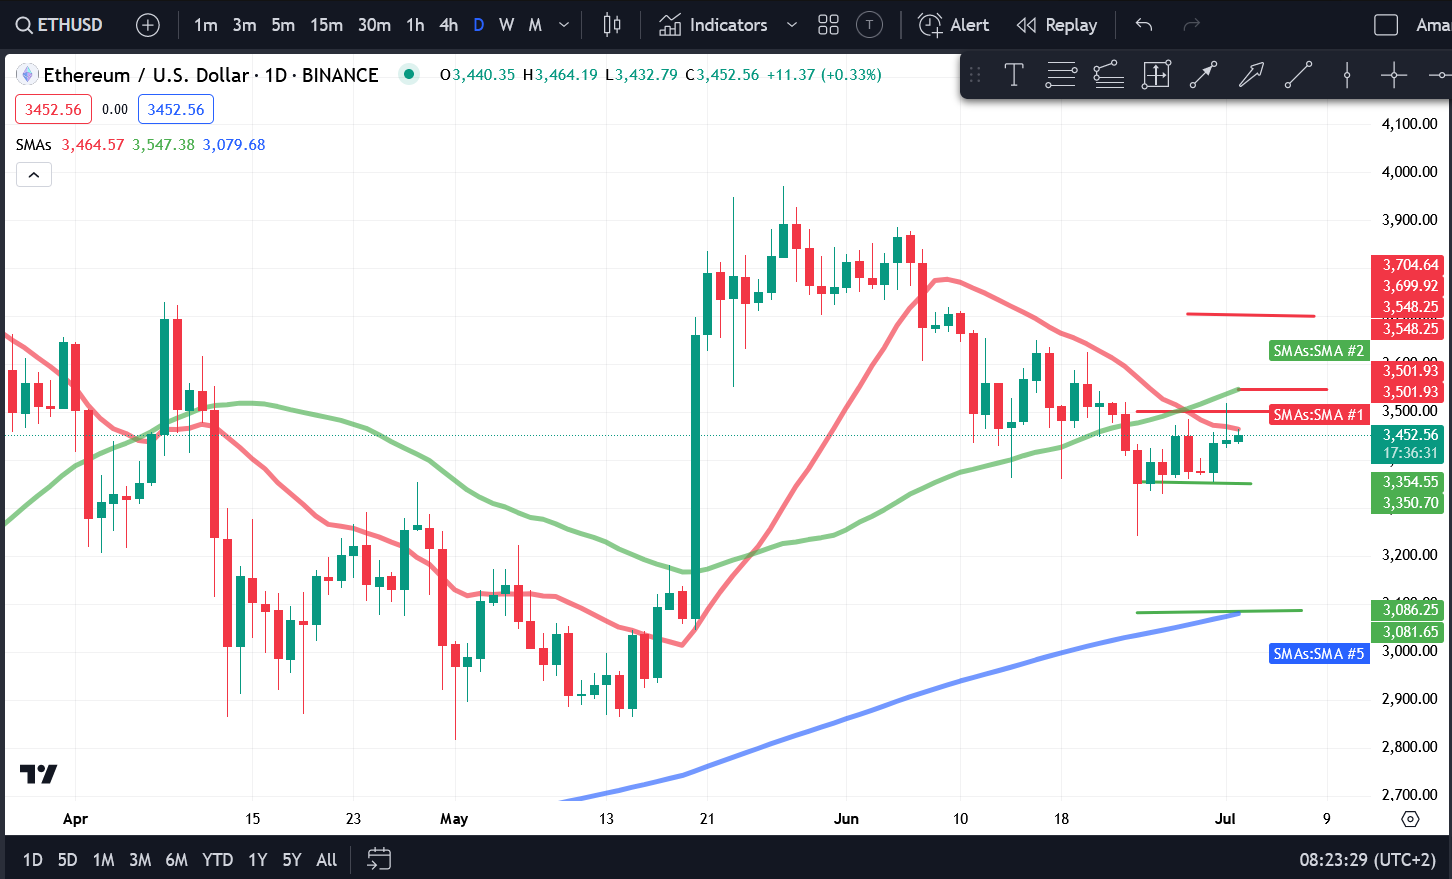
Source: TradingView
The current session sees ETH trading at $3,450, with buyers making yet another attempt to push ETH past the 20-day SMA. ETH is likely to face strong resistance at both moving averages (20-day SMA and 50-day SMA). If buyers can push ETH above the 20-day SMA and $3500, we could see a move towards the 50-day SMA at $3,550. A break above the $3,550 mark could see ETH surge toward the 50-day SMA, which is expected to act as a significant level of resistance.
However, should ETH turn bearish again, we could see the price drop back to its support level of $3,350. Should this level be breached, ETH could drop to $3,100, where the 200-day SMA could act as a level of support.
BNB Coin (BNB) Price Analysis
The failure of sellers to push BNB Coin (BNB) below $560 on Friday is indicative of reduced selling pressure at lower levels. BNB dropped to $566 on Friday as buyers attempted to breach its support level. However, BNB was able to make a recovery over the weekend, rising by 0.51% on Saturday and then by 2.12% on Sunday to finish the week at $581. Monday began with buyers attempting to push BNB above the 20-day SMA. As a result, BNB reached a day high of $587.9 before bearish pressure forced the price lower. Eventually, BNB dropped 0.91% to end Monday at $576.6. The current session sees BNB up by 0.45%, trading at $579.1.
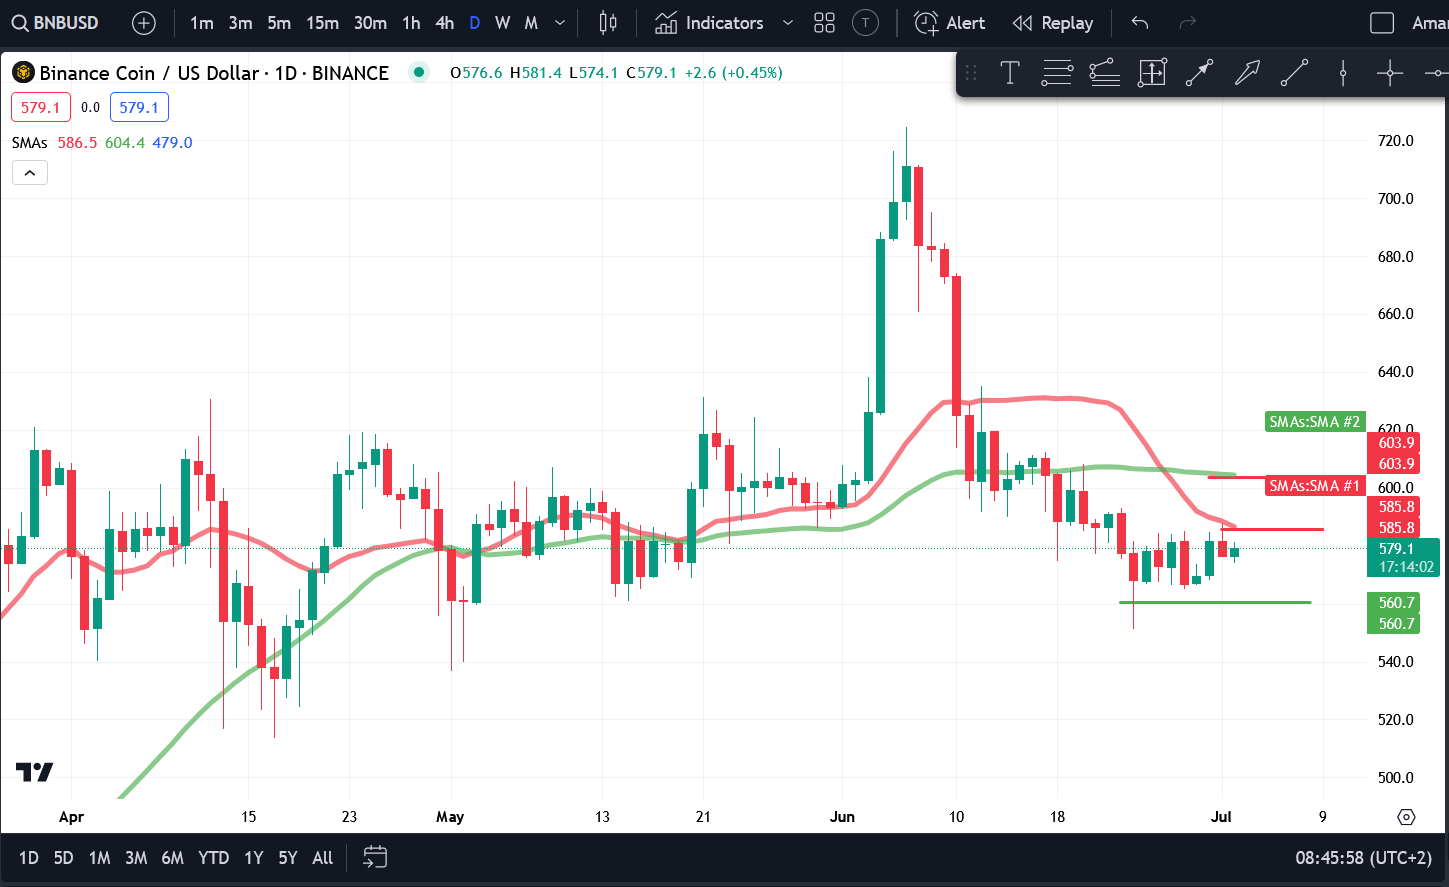
Source: TradingView
Should buyers retain control of the session, they could attempt to push BNB past the 20-day SMA to $600. Should bullish momentum continue, BNB could surge towards $650-$700. However, should buyers retake the current session, BNB could drop to its support level of $560. BNB could drop to between $500 and $530 if this support level is breached.
Solana (SOL) Price Analysis
Solana’s (SOL) bullish momentum has stalled during the current week as sellers vigorously defend the $150 level. The cryptocurrency had registered a staggering increase of 9.40% on the back of the VanEck spot ETH application. However, bears were able to push back strongly, dragging ETH back below the 20-day SMA after a drop of 6.51%, with the price settling at $139.90. SOL began the weekend in the green as it attempted to move above the 20-day SMA. However, it could not sustain bullish momentum and dropped back below the SMA, registering only a marginal increase.
However, a strong rally on Sunday saw SOL break past the 20-day SMA and rise to $146.52. The current week began with a marginal increase as sellers attempted to push above the $150 resistance zone. However, with strong selling pressure at this level, SOL fell back to $146. The current session sees SOL at $147.63. SOL reached a day high of $149.76 but could not push to $150 and fell back to its current level. Should buyers push SOL above the crucial $150 level, we could see the price climb to $155. If SOL is able to break above this level, we could see a surge to $170 or $180.
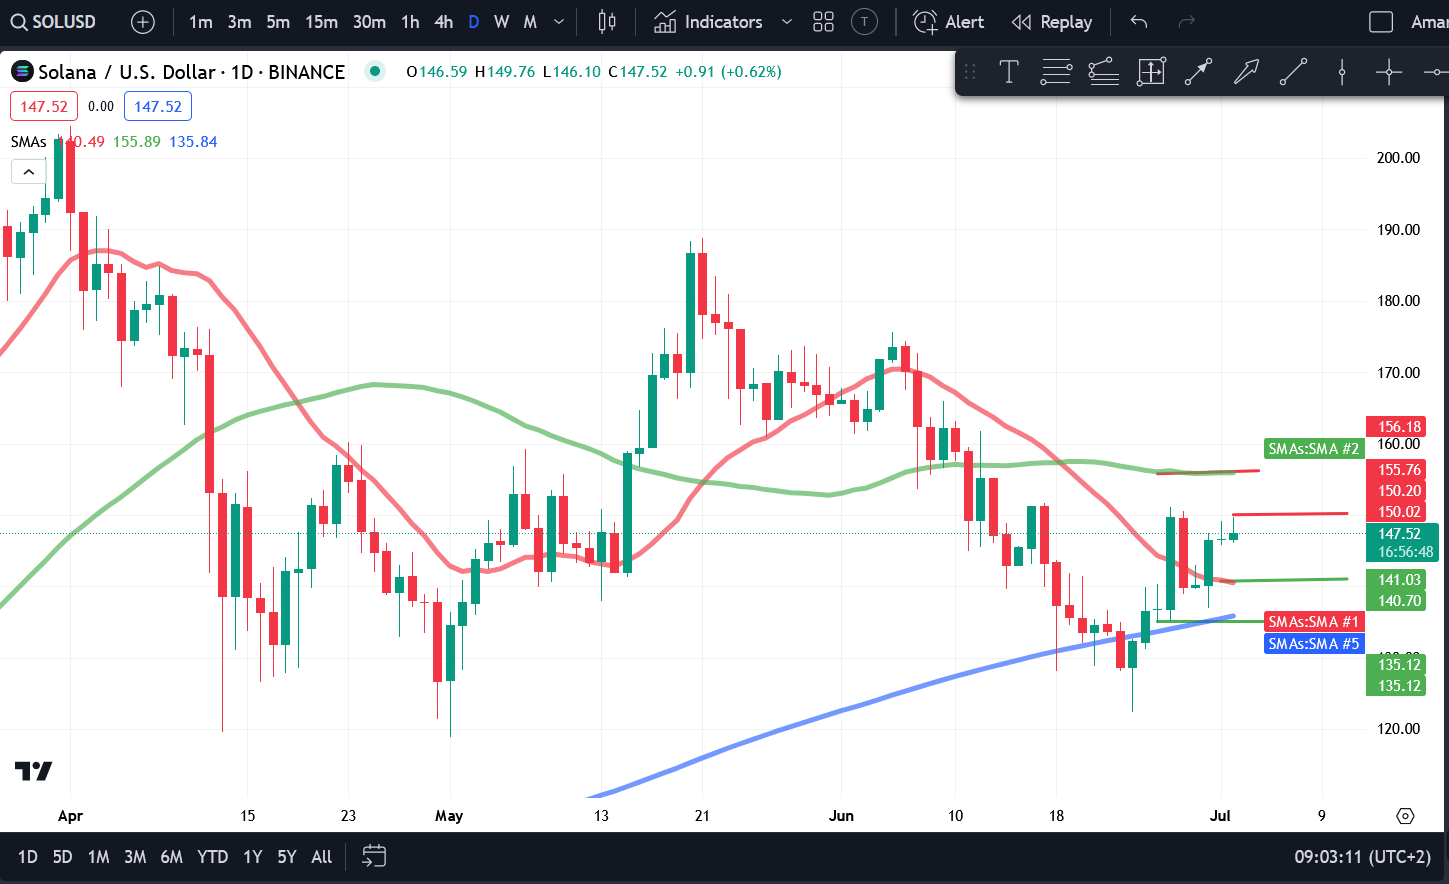
Source: TradingView
However, should the momentum turn bearish, we could see SOL drop back to $140. A further drop could see SOL drop to $135, where the 200-day SMA could act as a dynamic level of support and prop up the price.
Avalanche (AVAX) Price Analysis
Avalanche (AVAX) had been trading in a descending trendline until last week when it rebounded after hitting $24. Since then, it has maintained an upward trajectory, hitting $27.91 on Thursday and reaching a day high of $29.04 as buyers attempted to push past a crucial level of resistance at $30. However, AVAX fell back to $27.92 thanks to significant selling pressure due to the 20-day SMA. The weekend saw a marginal drop of 0.67% after yet another attempt to move past the 20-day SMA. However, Sunday saw a strong rally, with AVAX rising nearly 6% to move past the 20-day SMA and settle at $29.34.
The current week began with AVAX crossing $30, as it reached a day high of $30.08. However, it could not sustain at this level, and sellers pushed the price back below $30, with AVAX settling at $28.80. Many had expected a bullish rally when the price crossed $30. However, sellers have pushed AVAX back, with the asset down by over 2% during the current session and trading at $28.20. AVAX could drop further if bearish sentiment persists, but the 20-day SMA could act as a level of support and allow the price to stabilize. A drop below this level could see AVAX dragged down to $25.
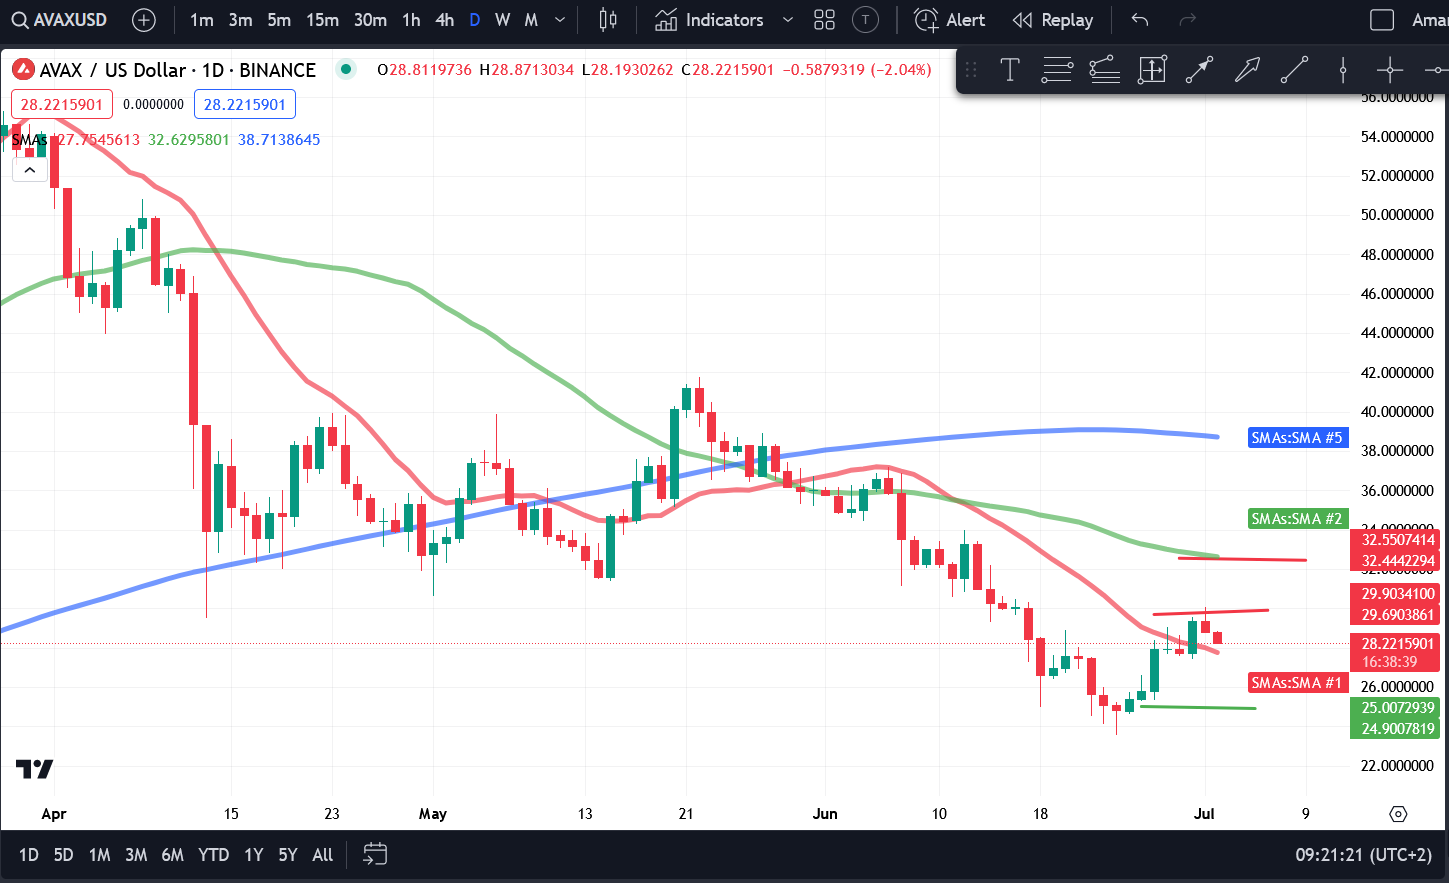
Source: TradingView
Bullish sentiment could return if AVAX closes above $30. In such a scenario, we could see AVAX push to $32.
Shiba Inu…
Read More:Crypto Price Analysis 7/02 – BTC, ETH, BNB, SOL, AVAX, SHIB, MATIC, TON