

Brace for volatility as $500 million moves in Bitcoin trading
Bitcoin (BTC) continues to captivate attention as it consolidates slightly above the $60,000 mark. As the market eagerly anticipates Bitcoin’s next move, recent activities reveal significant bid volumes and liquidity shifts.
These movements highlight intriguing patterns and potential opportunities, offering valuable insights for both traders and investors.
Popular trader Daan Crypto Trades has noted substantial bids below the spot price and a rise in open interest. Recent data shows an impressive $500 million in bids placed below Bitcoin’s spot price, around $59,500 to $60,583.
This influx of bids creates a strong support zone, helping to prevent significant price drops. After a notable decline, Bitcoin stabilized and began to rise, climbing back above $61,000. This support indicates strong buying interest, a positive sign for long-term value, providing traders with potential entry points with reduced downside risk.
Bid volumes and liquidity shifts
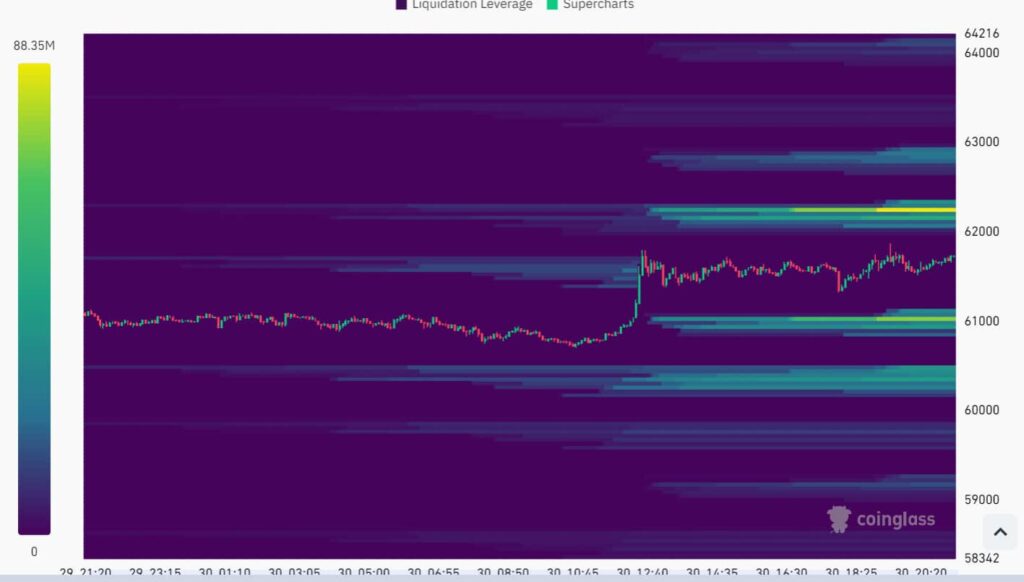
The heatmap highlights concentrated bids at various price levels, with a dense cloud of bids towards $59,500, forming a critical support zone. Conversely, liquidity has shifted higher as prices move beyond $61,600, showing traders’ readiness for potential upward movements.
Increased trading activity and open interest suggest more market participation, with traders building and unwinding positions. These shifts indicate where liquidity is concentrated, helping traders anticipate price moves and adjust strategies accordingly.
Moreover, the latest data from monitoring resource CoinGlass shows significant liquidation levels between $61,000 and $63,000, marked by high liquidation leverage areas. Traders should be aware of these zones, where forced selling could occur, adding to market volatility. Monitoring these levels is crucial for risk management and trading opportunities.
Market sentiment and historical performance
Michaël van de Poppe, founder and CEO of MNTrading, remains optimistic despite a recent 2.6% decline week-to-date. He suggests the recent correction phase might be nearing its end, comparing the current market behavior to previous cycles where deep corrections were not always evident.
Although Q2 performance overall remained weak, with Bitcoin down 13.8%, June alone accounted for 8.9% of the losses. Historically, when Bitcoin had a negative June, it tended to bounce back strongly in July. In fact, BTC has shown an average return of 7.98% and a median return of 9.60% during this month, as highlighted by popular trader Ali Martinez.
BTC price analysis
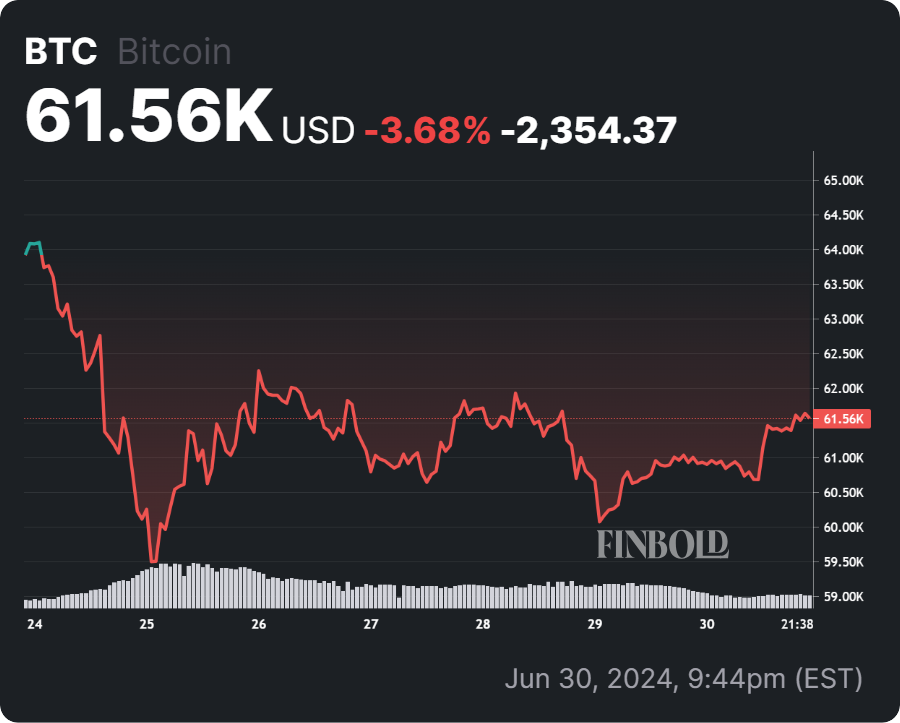
By press time, Bitcoin was trading at $61,576, with daily gains of almost 1% in the 24-hour chart.
With strong support forming at lower price levels and an optimistic outlook from seasoned traders, there is potential for upward price movement.
However, the dynamic liquidity zones increased open interest, and significant liquidation levels indicate that volatility may remain high.
Whether a seasoned trader or a new investor, staying vigilant and monitoring key support and resistance levels will be crucial in navigating this volatile market.
Disclaimer: The content on this site should not be considered investment advice. Investing is speculative. When investing, your capital is at risk.
Read More:Brace for volatility as $500 million moves in Bitcoin trading