

Bitcoin Price Prediction: 2024, 2025, 2030
BTC price prediction: Key highlights
1. Primary support and resistance levels
- Our analysis of the weekly time frame revealed $40,000 to be the lowest probable support for BTC in 2024.
- As the king coin ascends, it can face its highest resistance at around $70,000 to $75,000.
2. Market sentiment
- In April 2024, Bitcoin has been undergoing a correction after being overbought.
3. Predictive forecasts
- Our AI/ML predictive models forecast that Bitcoin can likely average over $145,000 in 2028 and over $800,000 in 2035.
Gain valuable insights on BTC’s future trajectory through a comprehensive weekly technical analysis, followed by coming days of the month, upcoming months, and yearly forecast tables derived from our AI/ML-based predictive models:
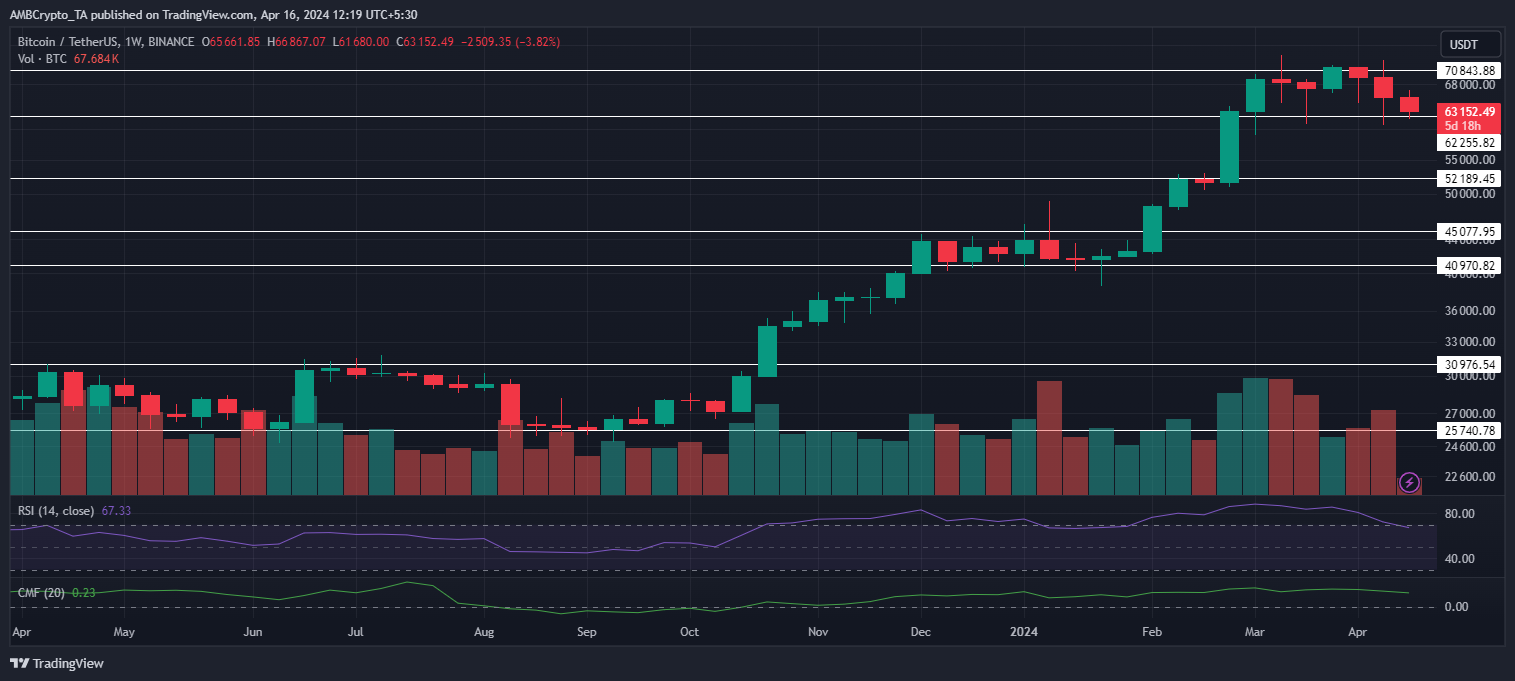
BTC technical analysis: Will the price recover before the halving?
In 2023, BTC demonstrated a remarkable recovery from its lows in 2022, showcasing a year of significant volatility and growth. This year, the king coin is experiencing a massive bull run. Yet, the recent political instability has posed many challenges. Many analysts anticipate the Bitcoin price prediction for 2024 will be monumental as the price can achieve record-breaking levels.
The period under review started with the price testing the resistance at $30,000 in April. However, this led to a slight rejection, and the price retracted to $25,000. This pattern repeated in mid-June when the coin’s retest of the resistance led to subsequent declines. The price eventually fell back to $25,000 by mid-August.
It wasn’t until the end of October that BTC finally broke through this resistance. Continuing this rally, the price successfully claimed $40,000 as support by December. After this, the price consolidated between this support and the resistance at $45,000.
In February, BTC experienced a significant bullish breakout that saw the cryptocurrency surge through the $45,000 barrier for the first time since April 2022. As the month progressed, bullish momentum intensified, with the $52,000 resistance level vigorously tested by bulls.
By the end of February, this resistance was successfully converted into a support level, highlighting the strength of the rally. Concurrently, Bitcoin’s market capitalization reclaimed the $1 trillion mark, as per CoinMarketCap.
The uptrend carried into March, and Bitcoin hit $73,777 on Binance, surpassing its previous all-time high (ATH). However, a retracement occurred, with prices dropping as low as $60,000 the following week.
This was another significant drawdown since the exchange-traded fund (ETF) launch, with the earlier drawdown being 20%. While notable, this post-ETF decline was considered a necessary adjustment for Bitcoin’s price to accelerate its growth.
Despite this pullback, BTC managed to retest the high resistance at $70,000 towards the end of the month. This resulted in a decline closer to the current support at $62,000. As the analysis concluded, BTC closed at $63,152.
AMBCrypto’s analysis revealed that as the halving event nears, prices might temporarily dip due to a “sell the event” reaction before the market regains its momentum. This has materialized, as evidenced by the recent price movements.
The recent increase in the Net Taker Volume combined with a drop in Bitcoin non-fungible tokens (NFT) sales has further fueled the drop. Additionally, AMBCrypto pointed to new data that showed that the Bitcoin Realized Profit/Loss Ratio fell below one. In the past six months, such trends have often indicated a potential local bottom for BTC.
While the current market conditions might suggest short-term negativity, they may also set the stage for an upcoming rebound or stabilization phase. Furthermore, Bitcoin is approaching its next halving event in less than a week. This could generate bullish sentiment, supporting Bitcoin’s price recovery in the near future.
A number of experts are forecasting significantly higher valuations for Bitcoin. These predictions suggest that BTC could escalate to monumental price points of $100,000 to $150,000. This optimistic outlook hinges on IT’s ability to push past a critical threshold of $70,000 to $75,000. Sustained momentum above these levels can likely put $90,000 on the cards.
Despite these bullish forecasts, the potential for a downtick is scrutinized amidst the market crash due to geopolitical uncertainty. A bearish breakdown could see Bitcoin’s value dropping to between $40,000 and $50,000. Such a scenario would likely be temporary, paving the way for Bitcoin to rebound and attain new heights.
Based on the future predictions from our predictive models, BTC is forecasted to experience a significant increase in value. Within four years, the coin is anticipated to trade at an average price exceeding $145,000. Looking ahead, the projections become even more striking.
Our models predict that Bitcoin’s average price will exceed $800,000 by 2035. This long-term forecast highlights Bitcoin’s expected continued growth and adoption as a major digital asset in the financial landscape.
BTC’s 2024 roadmap: Key indicators to watch and trade
- The Relative Strength Index (RSI) generally remained bullish. In mid-August, there was a temporary dip below 50, but it recovered by the end of September.
- By the end of October, the RSI moved into the overbought region. However, a minor price drop in January caused the indicator to move below this region and remain there for most of the month.
- In February, the RSI resumed its upward trajectory, reaching a high value of 88.36 in March. By the end of the analysis, the indicator registered at 67.33. It could be an indication of either a cooling off of the upward momentum or a stabilization without a sharp reversal.
- The Chaikin Money Flow (CMF) followed a comparable pattern. Its peak value was recorded in mid-July at 0.41. The indicator dipped into the negative territory between August and mid-October before turning positive again.
- Since then, it has mostly been trending higher, standing at 0.23. This value reflected a slight dip yet highlighted the strong buying pressure and accumulation.
- The trading volume mirrored the price movements. The bullish rallies saw the volume recover significantly, indicating that they were backed by substantial investor interest.