

Bitcoin Price Prediction as $8 Billion Trading Volume Floods In – Time to Buy?
Bitcoin‘s current technical landscape underscores a critical juncture, with the cryptocurrency trading around $42,885. The asset’s immediate resistance levels are charted at $43,457, $43,844, and $44,335, delineating potential ceilings for upward movements.
On the downside, support is positioned at $42,535, followed by $41,950 and $41,395, marking pivotal zones for price stabilization.
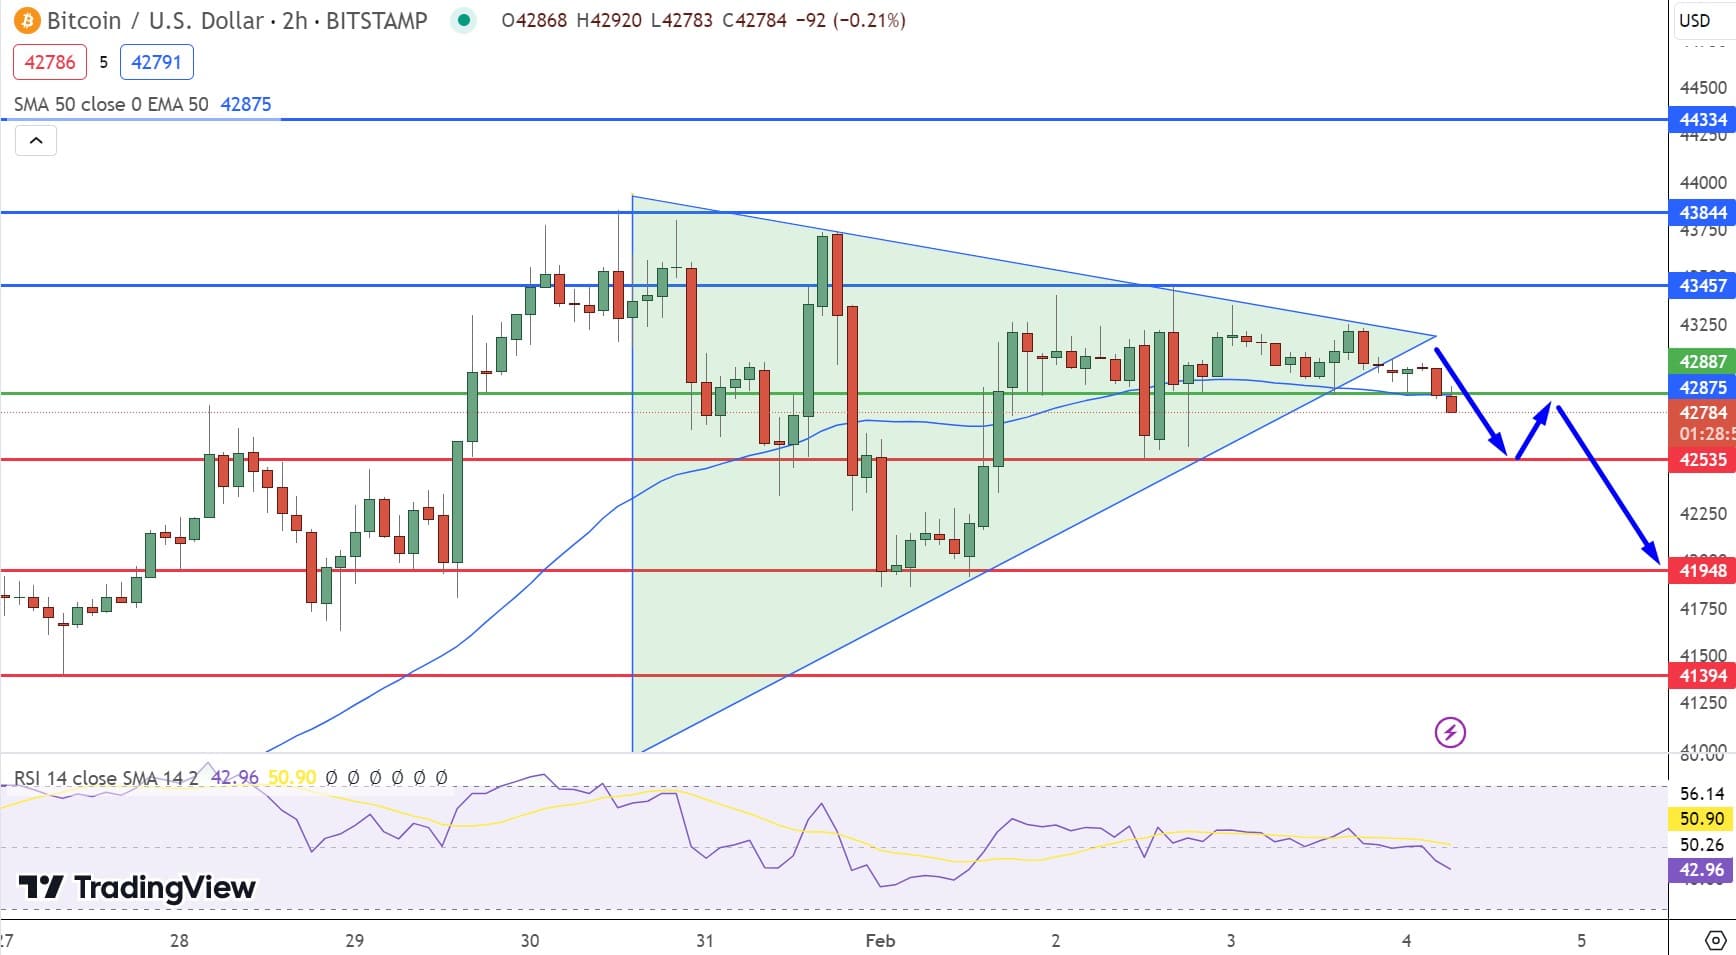
The Relative Strength Index (RSI) hovers around 48, indicating a neutral market sentiment, while the 50-Day Exponential Moving Average (EMA) at $42,710 slightly supports the current price level.
However, a symmetrical triangle breakout below $42,885 suggests an emerging selling trend, steering the short-term outlook towards bearish beneath this threshold.
Read More:Bitcoin Price Prediction as $8 Billion Trading Volume Floods In – Time to Buy?