

Bitcoin Bear Markets: What, Why, When?
Bitcoin has had its fair share of bear markets in the past. Let’s briefly recap the most significant ones and see what we can learn from them.
The 2011-2012 Bear Market
The bitcoin price fell from $29 on June 8, 2011 to $2.10 on November 18, 2011, followed by months of sideways action:
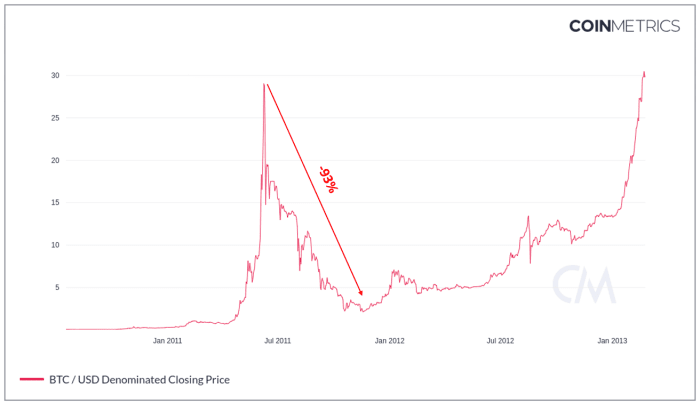
The first bear market, 2011-2012. Chart data source: CoinMetrics.io
The most painful bear market happened before most of us were even aware that something like bitcoin existed. More than ten years ago, the price of bitcoin reached almost $30 on the then-popular Mt. Gox exchange, only to be followed by a “stairway to hell” pattern that would take the price to $2.10 in a several months’ time.
Bitcoin dumped 93%! But consider this: buying bitcoin even at the all-time high (ATH) price of $30 would still have been a steal from today’s perspective. Who wouldn’t want to stack some bitcoin at $30 dollars, right? Of course few back then could anticipate that in ten years, bitcoin would sit around $50,000; that’s why after that initial drop, it took more than a year for the price to recover and climb to new heights. The perception of what bitcoin actually is evolved over the decade as it went from a geeky experiment to darknet currency to an inflation hedge, and potentially the basis of the future global monetary system.
When the price breached the previous ATH in early 2013, it never dipped below that price level again.
The 2014-2016 Bear Market
Bitcoin’s price later tumbled from $1,135 on December 4, 2013 to $175 on January 14, 2015, followed by months of sideways action:
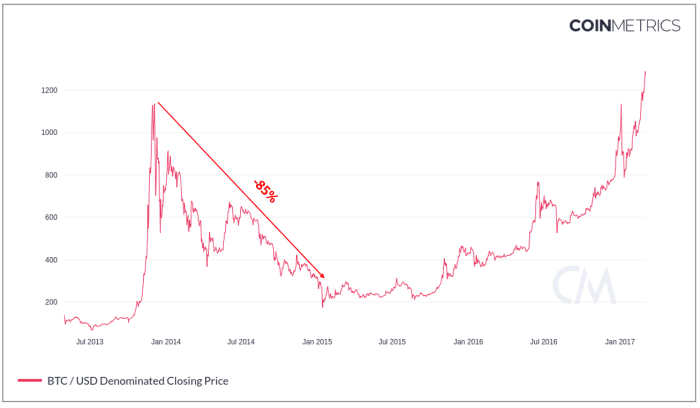
The second bear market, 2014-2016. Chart data source: CoinMetrics.io
At the turn of 2013/2014, two major things happened: the Silk Road marketplace was shut down (Ross Ulbricht is now serving a double life sentence without the possibility of parole), and the Mt. Gox exchange collapsed. These were the two most likely causes of the subsequent bear market. With two major bitcoin venues shut down and major losses sustained by their users, it seemed to some like bitcoin was dead and useless.
As bitcoin dropped 85% from the top to bottom, many “bitcoin obituaries” were written, usually with smug told-you-so undertones.
But those that were there during the 2011-2012 period learned their lesson: Bitcoin comes back – with vengeance! Builders kept on building, and some of the most pivotal tech was created during the second bear market: Trezor One, the world’s first hardware wallet, was released in early 2014, and the Lightning Network whitepaper was published in January 2016.
And when the price finally breached the previous ATH in early 2017, it never dipped below $1000 ever again.
The 2018-2020 Bear Market
One of the most famous “crashes” of Bitcoin’s career was a price fall from $19,640 on December 16, 2017 to $3,185 on December 15, 2018, followed, again, by months of sideways action:
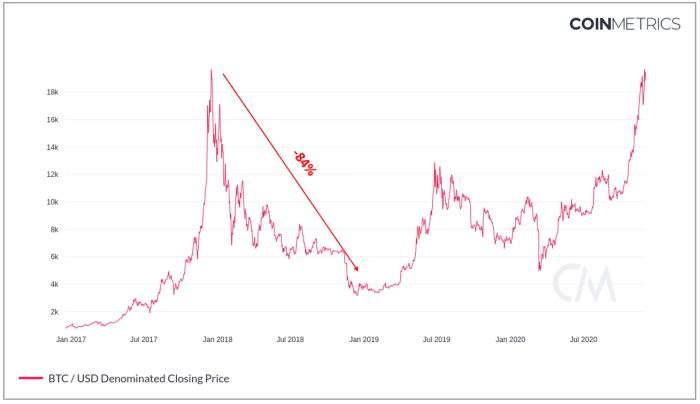
The third bear market, 2018-2020. Chart data source: CoinMetrics.io
The most recent bear market is sometimes dubbed “the crypto-winter,” mostly because the major shakeout and a drop to the low near $3,000 came in the winter of 2018/2019. This bear market was quite tough because of the fake rally of spring/summer 2019 when the price reached $12,000, only to drop back to $4,000 when the COVID-19 panic struck in full force in March 2020.
But again, bitcoin recovered with vengeance and may never return below its previous ATH of $20k again. Many indispensable ecosystem projects took off during this period – Trezor Model T and the Shamir Backup, BTCPay Server, most Lightning Network wallets and tooling, Jack Dorsey’s Spiral, Jack Mallers’ Strike, and many other tools and services we use today.
Can We Spot A Bear Coming For Us?
Per traditional definition, a bear market occurs when “prices fall 20% or more from recent highs, amid widespread pessimism and negative investor sentiment.” While the first part of this definition is easy to quantify — yes, bitcoin has dropped by that much from recent highs — the latter is very subjective.
A whole industry of on-chain metrics trying to determine the prevailing sentiment has been built over the years. But the problem with such metrics is that they themselves are built on subjective interpretations of what’s going on:
Some analysts try to predict the short and long term price action by pointing out a correlation between price rallies and the block reward halving cycle – a 4-year cycle which halves the rate at which the bitcoin supply increases. And it does seem convincing:
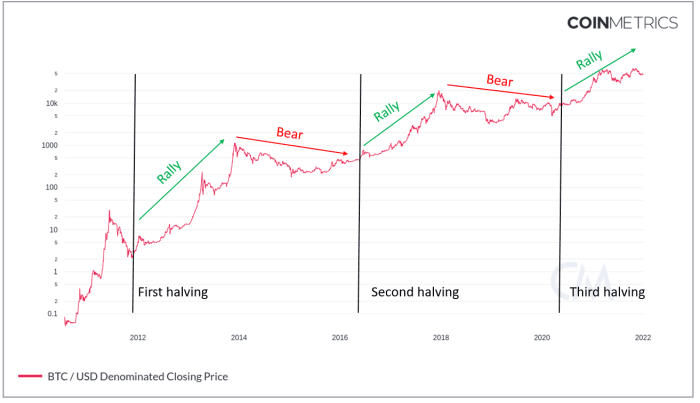
Block reward halvings and price action 2010 – 2022, log scale. Chart data source: CoinMetrics.io
The problem with the halving-cycle hypothesis is that so far, we only have two full data points: the periods after the first and second halvings. We are currently in the third period and even if the price action followed a similar pattern this time around, this still doesn’t have to mean anything. Per the efficient market hypothesis, predictable and widely-known facts such as bitcoin halvings cannot affect the price in such a massive way – there are other unseen factors in place (such as fiat currencies failing as a reliable store of value). The human mind likes to find patterns in the noise, and the volatile, upward-trending chart like bitcoin’s is very seductive in this regard.
I believe the long-term bitcoin price chart tells us something much more interesting than the alleged halving cycle. This is what we see when we look at the same chart from a different perspective:
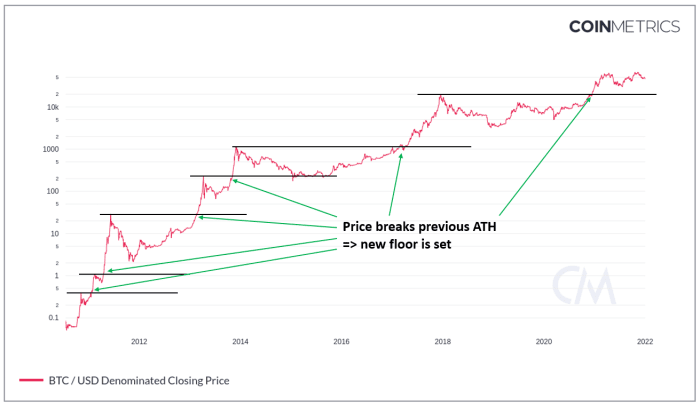
Price action 2010 – 2022, log scale. Chart data source: CoinMetrics.io
Instead of two halving cycles, we get six historic ATHs and find that the price doesn’t seem to dip below the previous ATH once it has been breached for the second time. If this holds true in the future, it would mean that price wouldn’t go below $20k if we were to enter a bear market now, and it wouldn’t go below $69,000 if we breached that price level for a second time. The explanation for this price action may be psychological: those yet undecided about bitcoin usually take the first steps once bitcoin is confirmed “not dead,” i.e., when it breaches the previous ATH, resulting in regular old fear of missing out (FOMO). Admittedly, this observation isn’t bulletproof, as the price briefly dipped below the $230 ATH set in April 2013, and is currently below the twice-breached ATH of $50,000 from 2021. I take this optimistic model as a personal rule of thumb so I can stack decisively if we were to dip close to $20,000 levels. That said, I do not wait for such magical opportunities that may never come, and I therefore stack sats regularly, no matter the price.
Overall, I don’t think anyone can spot a bear market forming. Bitcoin is traded 24/7 all around the world, both on centralized exchanges as well as peer-to-peer. The market is continuously influenced by both local and global effects, such as the collapse of the Lebanese pound or COVID-19-related restrictions. The best you can do is pick your favorite rule-of-thumb metric and stick to some basic rules.
Rules For Navigating A Bear Market
“Hey Joseph, what is this – just a bunch of historical charts and some barely working rules of thumb?” I know, I know. But this is the unvarnished truth: nobody has a crystal ball, and technical analysis doesn’t work better than a coin flip — this applies even if you paid big bucks for it.
Sometimes it’s better to acknowledge the chaotic nature of the market and prepare instead of predicting. Having a couple of bear markets under my belt, these are my personal rules for surviving the next crypto winter, whenever it comes:
Do not trade. First-time traders usually aim for “buy low, sell high.” But somehow, they end up doing the opposite, because their emotions get in the way. Trading is a very stressful zero-sum game, where most people lose their money: a recent Business Insider article pointed out that between 70-97% of day traders end up losing their money! Only…
Read More:Bitcoin Bear Markets: What, Why, When?